Introduction
Most large organizations collect data constantly - from ERP systems, CRM platforms, production lines, and customer touchpoints. Yet a familiar frustration persists: reports arrive too late, numbers conflict across departments, decisions get made on gut instinct, and no one agrees on which dashboard to trust.
The problem isn't a lack of data. It's a lack of infrastructure to turn that data into decisions.
Wavestone's 2024 Data and AI Leadership Executive Survey found that only 48.1% of Fortune 1000 organizations have successfully built a data-driven organization - and 77.6% cited culture, people, and process as the primary barriers, not technology.
This guide covers enterprise BI from the ground up: what it is, how the architecture works, which features actually matter, how leading platforms compare, and what AI is changing about all of it in 2025. Whether you're evaluating tools or building a data strategy, start here.
Key Takeaways
- Only 48% of Fortune 1000 companies have achieved data-driven decision-making - the gap is governance and culture, not tooling
- Enterprise BI scales beyond team-level tools through centralized governance, a shared semantic layer, and federated operating models
- Platform fit hinges on cloud ecosystem alignment, team skill level, and total cost of ownership - no single tool wins universally
- Gartner predicts 75% of new analytics content will use GenAI by 2027 - moving BI from static dashboards to proactive, agent-driven intelligence
- Platform fit depends on cloud alignment, team skill level, total cost of ownership, and compliance requirements
What Is Enterprise Business Intelligence?
Enterprise business intelligence is the deployment of BI tools, technologies, and processes at organizational scale. It integrates data across every department to deliver consistent, real-time insights to decision-makers - not siloed dashboards that tell different stories depending on who built them.
The Four Dimensions That Separate Enterprise BI
| Dimension | What It Means |
|---|---|
| Scale | Thousands of concurrent users, petabytes of data, without performance degradation |
| Governance | Role-based access, audit trails, certified metrics, and clear data ownership |
| Operating Model | Centralized data teams supporting federated analytics across business units |
| Semantic Layer | Shared KPI definitions - "revenue" means the same thing in sales, finance, and the boardroom |
Without these four elements, organizations don't have enterprise BI. They have a collection of dashboards that tell different stories.
From Reporting to Intelligent Action
The evolution of enterprise BI follows a clear arc:
- Static dashboards and scheduled reports - descriptive, backward-looking
- Self-service analytics - business users explore data independently
- AI-native platforms - systems that proactively surface anomalies, generate narratives, and trigger downstream workflows
Modern enterprise BI is no longer just a reporting infrastructure. It's the foundation for AI-driven automation - where insights don't wait to be found, they trigger the next step. The organizations getting the most value aren't just faster at reporting. They've connected their data layer directly to operational decisions.
How Enterprise BI Works: From Data to Decisions
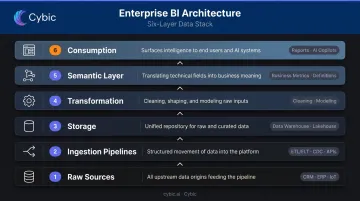
Enterprise BI runs on a layered architecture. Each layer serves a distinct purpose, and a weakness at any layer undermines everything above it.
The architecture stack, from bottom to top:
- Raw sources - CRM, ERP, finance systems, operational databases, IoT sensors
- Ingestion pipelines - ETL/ELT processes, Change Data Capture, API/webhook connections
- Storage - data warehouse (structured, query-optimized) or lakehouse (combines structured and unstructured)
- Transformation - cleaning, modeling, and preparing data for analysis
- Semantic layer - business logic and metric definitions applied consistently
- Consumption layer - dashboards, reports, AI copilots, embedded analytics
Data Collection and Integration
Enterprises use three primary integration patterns, and the right choice depends on latency requirements and cost:
- ETL/ELT pipelines - batch processing for historical and large-volume data; reliable, but not real-time
- Change Data Capture (CDC) - captures incremental changes without moving full datasets; near-real-time with lower infrastructure overhead
- API/webhook connections - event-driven, suitable for operational dashboards that need live data
AI-Driven Analysis
Modern platforms apply AI at the analysis layer in four ways:
- Natural language querying - business users ask questions in plain English and receive visual answers
- Anomaly detection - algorithms flag unusual patterns automatically, before analysts notice them
- Predictive forecasting - projects future outcomes from historical trend data
- LLM-powered copilots - explain charts, summarize reports, and generate narrative context
AI analysis is only as reliable as the underlying data quality. Deploying AI on top of inconsistent or incomplete data produces confident-sounding wrong answers.
Visualization, Reporting, and Action
The output layer extends well beyond dashboards. It includes scheduled reports pushed to inboxes, embedded analytics within ERP and CRM applications, and mobile-accessible KPIs for field teams.
The gap most platforms leave open sits between insight and action. Detecting an anomaly only matters if the organization can respond quickly. Platforms that connect analytics outputs to automated workflows - where a detected insight triggers a corrective action without waiting for human intervention - represent the next maturity level.
Cybic's Drava platform addresses this directly, connecting enterprise data, machine learning, and AI reasoning to intelligent automation agents that act on insights rather than just surface them.
Key Features Every Enterprise BI Platform Must Have
Self-Service Analytics
True self-service means business users - not data engineers - can build reports and explore data independently. This requires:
- Intuitive drag-and-drop interfaces
- Natural language querying
- Pre-certified, trusted datasets
- Guided discovery for less technical users
Without genuine self-service, BI investments create a new bottleneck: the central analytics team that every department depends on for every report.
Data Governance and Security
A 700-practitioner survey reported by TDWI found that 80% of data professionals ranked data security and governance as top priorities for 2024, with 56% reporting that current security processes slow data access.
Enterprise BI platforms must include:
- Role-based access controls (RBAC) - users see only what they're authorized to see
- Row-level and column-level security - for sensitive datasets
- Data lineage tracking - trace any metric back to its source
- Audit logs - for compliance and regulatory review
- KPI certification workflows - prevent conflicting metric definitions from circulating
Scalable Infrastructure and Deployment Flexibility
Enterprise-grade platforms must handle high data volumes and large numbers of concurrent users without performance degradation. Platforms that aren't tied to a single cloud provider give organizations far more flexibility as infrastructure needs evolve.
Key deployment considerations include:
- Supports cloud, hybrid, and on-premises environments
- Scales horizontally to handle concurrent user load across business units
- Operates across AWS, Azure, and GCP without re-engineering data pipelines
- Avoids proprietary lock-in that limits future vendor negotiation
AI and Predictive Analytics Capabilities
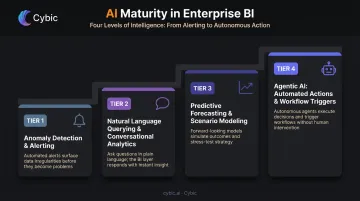
Four tiers of AI maturity in enterprise BI:
- Automated anomaly detection and alerting - expected on every platform in 2025
- Natural language querying and conversational analytics - now standard on leading platforms
- Predictive forecasting and scenario modeling - requires quality historical data
- Agentic AI: the platform takes actions or triggers workflows based on detected insights; often requires additional licensing and governance frameworks
Integration Ecosystem and Semantic Layer
Enterprise BI must connect to the full technology stack, including:
- ERP and CRM systems
- Cloud data warehouses (Snowflake, BigQuery, Redshift)
- SaaS applications and real-time data feeds
The semantic layer ties it together: it defines business metrics once - with all filters, calculations, and logic - and makes those definitions available across every report and dashboard.
Without a semantic layer, finance calculates gross margin one way, sales calculates it another, and executives spend meetings reconciling the gap instead of acting on the data.
Benefits and Business Impact of Enterprise BI
Faster, More Accurate Decisions
Decision-makers get access to accurate, current data from a single source of truth. Standard reporting requests that took days can now be answered in hours, or in seconds with self-service tools. Academic research by Brynjolfsson, Hitt, and Kim found that firms using data-driven decision-making showed 5% to 6% higher output and productivity than expected from other investments alone.
Operational Efficiency
Enterprise BI eliminates manual reporting cycles and surfaces bottlenecks through process analytics. Self-service adoption reduces the volume of ad hoc requests flowing to central data teams, freeing those teams to build rather than maintain. One Forrester TEI study for Looker reported a 99% reduction in reliance on BI teams for analytics after implementation (note: vendor-commissioned; treat as directional).
Competitive Advantage
Those efficiency gains compound into broader strategic advantages. Enterprise BI enables organizations to analyze customer behavior, purchasing patterns, and market trends at scale. The practical outcomes:
- Faster response to shifting market conditions
- More personalized customer experiences
- Improved demand forecasting and resource allocation
- Earlier identification of margin erosion, churn risk, and supply disruptions
Enterprise BI in Action: Industry Use Cases
| Industry | BI Use Case | Decision Enabled |
|---|---|---|
| Manufacturing | Predictive maintenance (sensor data); supply chain optimization | Schedule maintenance before failure; flag supply chain delays early |
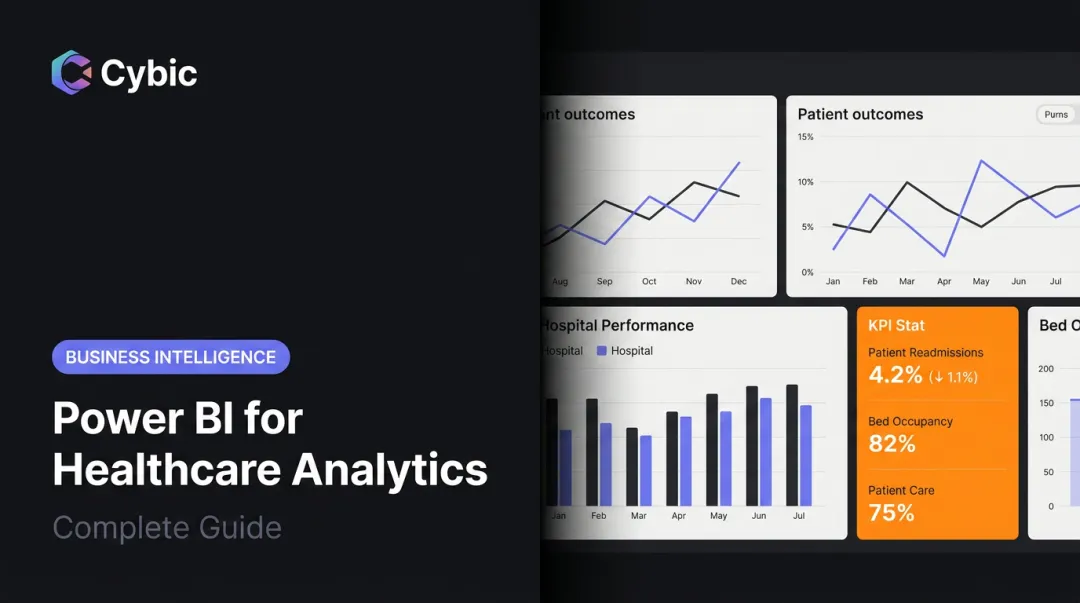
| Healthcare | Patient outcome analysis; clinical workflow efficiency; compliance reporting | Identify effective care protocols; locate operational bottlenecks |
| Retail | Inventory optimization; demand forecasting; customer behavior analysis | What to stock, where, and when; which segments to prioritize |
| Oil & Gas / Energy | Real-time infrastructure monitoring; safety compliance dashboards; production analytics | Spot safety risks before incidents; optimize production output |
Real-world examples include Cigna using Tableau to support data-driven care for 95 million customers, IndianOil using Qlik Sense across 3,000 KPIs combining AI/ML with refinery operations, and Trek Bicycle accelerating retail analytics by up to 90% using Qlik and Databricks.
These results share a common foundation: data maturity. Organizations that have already centralized and cleaned their operational data extract significantly more value from BI. Data must be fresh, complete, accurate, and auditable before it can support high-stakes decisions. Cybic refers to this standard as "decision-grade data" - a threshold that requires structured data readiness work before BI deployment begins.
Top Enterprise BI Tools Compared
| Platform | Best For | Key Strength | Key Limitation | Deployment |
|---|---|---|---|---|
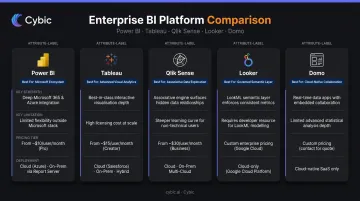
| Microsoft Power BI | Microsoft/Azure ecosystem | Cost-effective; Copilot AI; Fabric integration | Advanced features require Premium licensing; Azure dependency | Cloud, hybrid, on-prem |
| Tableau | Visual analytics; Salesforce shops | Industry-leading visualization; cloud-agnostic | High licensing costs at scale; requires data warehouse investment | Cloud, on-prem |
| Qlik Sense | Exploratory, associative analysis | Unique associative engine; free navigation across data | Steep scripting curve; high RAM requirements (8 GB minimum) | Cloud, on-prem |
| Looker | Governed semantic modeling; GCP environments | LookML semantic layer; strong governance | Requires technical expertise to implement and maintain | Cloud (GCP-native) |
| Domo | All-in-one SaaS with broad connectivity | 1,000+ pre-built connectors | Vendor lock-in risk; data lives in Domo's cloud | Cloud SaaS |
Platform summaries:
- Power BI - Power BI Pro at $14/user/month and Premium Per User at $24/user/month. Named a Gartner Magic Quadrant Leader for the 18th consecutive year in 2025. Strong value within Microsoft/Azure environments; Copilot AI requires supported Fabric or Premium capacity.
- Tableau - Cloud Standard pricing from $15 (Viewer) to $75 (Creator)/user/month; Enterprise from $35 to $115/user/month. Best-in-class visualization with Salesforce integration. Tableau Next starts at $40/user/month for agentic analytics features.
- Qlik Sense - Associative engine enables exploratory analysis that traditional query-based tools can't replicate. Enterprise on Windows requires 8 GB minimum RAM, with memory tied directly to data volume. Gartner Magic Quadrant Leader for 15 consecutive years.
- Looker - LookML defines dimensions, calculations, and relationships in SQL databases. Strong governed semantic modeling, particularly within GCP/BigQuery environments. Implementation requires technical LookML expertise.
- Domo - 1,000+ verified connectors and compliance certifications including SOC 1, SOC 2, ISO 27001, HIPAA, and HITRUST. Named a Challenger in the 2024 Gartner Magic Quadrant.
Gartner predicts that 75% of new analytics content will be contextualized through GenAI by 2027, with autonomous analytics platforms managing 20% of business processes by the same year. Organizations evaluating platforms in 2025 need to assess more than reporting capabilities - the critical question is whether the platform can move from insight to automated action.
That's a gap traditional visualization tools weren't designed to close. AI-native platforms like Cybic's Drava address it directly, sitting alongside existing BI infrastructure to add AI reasoning and workflow automation where conventional dashboards stop.
How to Choose the Right Enterprise BI Platform
Four Constraint Filters
1. Cloud platform alignment Your existing cloud infrastructure should heavily influence your choice. Azure shops naturally align with Power BI and Fabric. GCP environments benefit from Looker's BigQuery integration. Multi-cloud organizations have more flexibility with Tableau or Qlik, but cross-platform friction adds cost and complexity.
2. Team technical skill distribution Platforms range significantly in required expertise:
- Power BI and Tableau offer lower barriers - drag-and-drop interfaces, broad user adoption
- Qlik and Looker demand higher technical skill - scripting and LookML data modeling respectively
Deploying a high-skill platform to non-technical business users drives poor adoption and wasted investment.
3. Total cost of ownership Look beyond license fees. Forrester's BI TCO analysis notes that initial hardware costs alone can represent 33–50% of software price, with ongoing maintenance adding further costs annually. For cloud platforms, watch for:
- Licensing tier cliffs as user counts grow
- Connector and integration fees
- Data warehouse costs separate from BI licensing
- Implementation, training, and change management
4. Governance and compliance requirements Regulated industries - healthcare, energy, financial services - must evaluate RBAC, audit trails, data residency, and encryption at the architectural level. These cannot be add-ons. Gartner predicts 80% of data and analytics governance initiatives will fail by 2027 without executive sponsorship and measurable adoption milestones.
Common Implementation Failure Patterns
- Select a platform before solving data quality, and you've bought a tool your data can't support
- Deploy sophisticated exploration tools to non-technical teams, and adoption collapses
- Overlook vendor lock-in, and proprietary formats will make future migration expensive
A Practical Selection Process
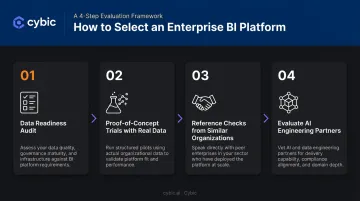
- Conduct a data readiness audit before evaluating platforms - what percentage of your data is analysis-ready today?
- Run proof-of-concept trials with your actual organizational data, not vendor-supplied demos
- Check references from organizations of similar size and industry
- For enterprises that want to move beyond BI into AI-driven automation, evaluate AI engineering partners - not just BI software vendors - as part of the selection process
Cybic begins every engagement with a structured data assessment and gap analysis - determining whether existing infrastructure can support the BI or AI outcomes an organization is targeting before any platform deployment starts.
Frequently Asked Questions
What are business intelligence services?
Business intelligence services encompass the tools, technologies, and processes organizations use to collect, analyze, and visualize business data. The goal is to enable leaders to make decisions based on accurate, timely information rather than intuition or incomplete reports.
What is the difference between enterprise BI and traditional BI?
Enterprise BI operates at organizational scale (thousands of users, petabytes of data) with governance controls, audit trails, and shared metric definitions enforced across departments. Traditional BI typically serves individual teams or projects, creating the data silos and conflicting numbers that enterprise BI is designed to eliminate.
What are the key components of an enterprise BI platform?
Core components include:
- Data integration pipelines and a central data warehouse or lakehouse
- Transformation and data modeling layers
- A semantic layer for consistent metric definitions across teams
- Self-service analytics and visualization tools
- Governance and security controls, including RBAC and audit logging
How does AI change enterprise business intelligence?
AI moves enterprise BI from passive reporting to proactive intelligence. Beyond natural language querying and automated anomaly detection, AI-enabled platforms can trigger actions or workflows directly based on detected insights - no human intervention required.
What is the difference between enterprise BI and embedded analytics?
Enterprise BI is a standalone platform for comprehensive analysis and reporting across the organization. Embedded analytics integrates insights directly into existing applications - CRM, ERP, or custom tools - so users access relevant data within their operational workflows without switching to a separate analytics environment.
How long does enterprise BI implementation typically take?
Timelines vary significantly. Cloud SaaS platforms with pre-built connectors can be operational in weeks. Complex on-premises deployments with extensive data modeling, transformation work, and user training typically run 6–18 months. The most common delays come from data quality and integration work that was underestimated at the outset.