Introduction
Most enterprises aren't short on data. They're short on answers. Spreadsheets multiply, databases sprawl across departments, and report requests pile up in BI queues - yet decision-makers still can't get a clear picture of what's actually happening in the business.
A well-architected Power BI solution changes this. Rather than adding another reporting layer to an already fragmented environment, it creates a governed, unified platform that connects disparate data sources and applies consistent business logic - putting accurate, interactive reports in front of the people who need them.
This guide covers:
- What a Power BI solution actually is - and how it differs from ad hoc dashboards
- The six-phase development process that separates successful deployments from failed ones
- The technical foundations - data modeling, DAX, visualization - that determine quality
- The governance and security controls enterprise deployments require from day one
Key Takeaways
- A Power BI solution is a complete analytics system covering data pipelines, a semantic model, and governed report distribution - not just charts
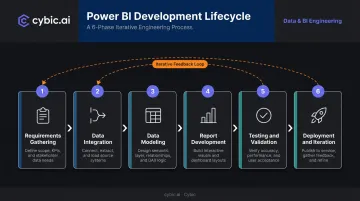
- Development follows six phases: requirements gathering, data integration, modeling, report development, testing, and deployment
- Star schema and DAX are the technical foundation; get these wrong and everything built on top is unreliable
- Governance - RLS, sensitivity labels, workspace roles - belongs in the architecture, not bolted on after launch
- Modern solutions connect to Azure Synapse, Snowflake, and Databricks, and increasingly incorporate ML predictions and AI-generated narratives
What Is a Power BI Solution?
A Power BI solution is a governed, end-to-end analytics system built on Microsoft's Power BI platform. It covers data ingestion and transformation, a structured semantic model, interactive reports and dashboards, and a collaboration infrastructure via Power BI Service. The key distinction: it is an engineered system aligned to specific business questions, not a collection of charts.
Ad Hoc Reports vs. a Power BI Solution
The distinction matters. "Using Power BI" might mean an analyst connects to a spreadsheet, builds a few visuals, and emails a screenshot. A Power BI solution means maintained data pipelines, a governed semantic model, access controls, and a repeatable publishing process. One is a handwritten note - the other is a published reporting system with change management behind it.
The Three Solution Tiers
Most enterprise deployments follow three tiers, each carrying different complexity and governance requirements:
| Tier | Who Uses It | Key Characteristics |
|---|---|---|
| Self-Service BI | Individual analysts | Personal data exploration, minimal governance |
| Departmental BI | A team or function | Shared governed model, team-level access controls |
| Enterprise BI | Organization-wide | Centrally governed semantic model, formal deployment pipelines |
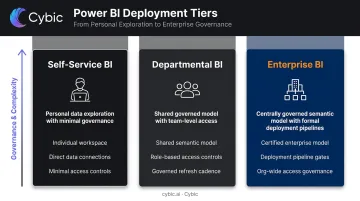
Each step up this ladder increases stakeholder involvement, governance requirements, and the cost of getting the foundation wrong.
Core Components of a Power BI Solution
The Three Tools
Microsoft structures the Power BI ecosystem around three primary tools:
- Power BI Desktop - where developers build data models, write DAX, and design reports locally
- Power BI Service - the cloud platform (app.powerbi.com) for publishing, scheduled refresh, collaboration, and app distribution
- Power BI Mobile - for report consumption on phones and tablets, relevant for field teams in manufacturing, oil and gas, and similar industries
Desktop is where the solution is built. Service is where it lives, is governed, and reaches end users.
Data Source Connectivity
Power BI's connectivity breadth is what makes consolidation possible. It connects natively to:
- Relational databases: SQL Server, MySQL, PostgreSQL
- Cloud data warehouses: Snowflake, Azure Synapse Analytics, Databricks
- SaaS platforms: Salesforce, SharePoint, Dynamics 365
- Flat files and REST APIs
This range lets a single Power BI solution pull data from the CRM, ERP, and operational databases that previously lived in silos - the prerequisite for any organization-wide view.
The Semantic Model
The semantic model is the critical middle layer between raw data and end-user reports. It defines:
- Table relationships and data hierarchies
- Business logic and calculated measures
- Consistent metric definitions shared across all reports
A well-designed semantic model is why two analysts looking at the same report get the same number for "revenue." Consistent definitions are enforced at the model layer, not left to individual report builders to apply correctly.
Workspaces, Pipelines, and Apps
Power BI Service provides the release management infrastructure:
- Workspaces - collaborative environments with defined roles (Admin, Member, Contributor, Viewer)
- Deployment pipelines - structured dev → test → prod promotion to prevent untested changes from reaching users
- Power BI Apps - packaged content distribution to specific user audiences at controlled access levels
The Power BI Solution Development Process, Step by Step
A Power BI solution follows a structured development lifecycle. Skipping phases - particularly requirements gathering and data modeling - is the most reliable way to build something that gets abandoned six months later. Gartner research estimates poor data quality costs organizations at least $12.9M annually on average; the modeling and requirements phases are where that cost is either avoided or baked in.
Step 1: Requirements Gathering
Structured sessions with stakeholders define what the solution must actually solve. This means:
- Identifying the business questions that need answers (not just "we want dashboards")
- Defining KPIs with precise business definitions - revenue including or excluding returns? headcount permanent or including contractors?
- Mapping data sources and flagging quality issues early
- Producing wireframe mock-ups to align on layout before a single query is written
Engaging frontline users - not just executives - surfaces the nuances that save rework later. The output is a documented requirements spec, metric definitions, and approved mock-ups.
Step 2: Data Integration and Transformation
Power Query serves as the ETL engine. It connects to source systems, cleans data (handling nulls, removing duplicates, correcting inconsistent formats), reshapes it for modeling, and produces the structured tables the semantic model needs. The underlying formula language is M, which enables custom transformations beyond what the visual interface exposes.
Data quality at this stage determines the accuracy of every report built on top. A calculation applied to dirty data produces a precise wrong answer.
Step 3: Data Modeling
A well-structured model uses a star schema: fact tables containing measurable events (sales transactions, production records, claims) connected to dimension tables (dates, products, customers, facilities). This structure is Microsoft's recommended approach for Power BI semantic models because it simplifies DAX, optimizes query performance, and makes the model easier to extend.
Key decisions at this stage:
- Defining table relationships and cardinality
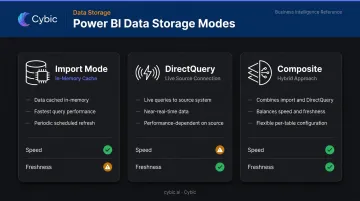
- Choosing Import mode (data cached in memory, fastest queries) vs. DirectQuery (live queries to source, near-real-time but performance-dependent) vs. Composite (both combined)
- Setting up date hierarchies and other dimension hierarchies that drive drill-down behavior
Step 4: Report and Dashboard Development
Visualization build covers chart selection, slicer behavior, cross-filter interactions, and drill-through pages for detail analysis. KPI cards give executives a summary view; drill-through pages let operational users dig into the underlying transactions behind any number.
Good report design follows the user's workflow, not the developer's aesthetic preference. A field supervisor looking at equipment downtime needs something different from a CFO reviewing margin by product line - both require deliberate design decisions.
Step 5: Testing and Validation
Testing runs in two distinct phases:
- Developer validation - content creators verify data accuracy, DAX calculation correctness, and report performance before users see anything. Outputs are compared against known source data to catch modeling errors.
- User acceptance testing (UAT) - business users validate that the solution answers their actual questions, not the developer's interpretation of those questions.
Microsoft's own validation guidance notes that obvious issues in BI content erode user trust and can harm long-term adoption. Iterative release cycles - delivering core functionality first, then expanding - are more effective than waiting for a "complete" solution.
Step 6: Deployment, Maintenance, and Iteration
Those iterative cycles culminate in a production release. Getting there requires:
- Publishing to the correct workspace with appropriate permissions
- Configuring scheduled data refresh against source systems
- Applying row-level security to enforce data access by role
- Distributing to end users via a Power BI App
Post-launch responsibilities don't disappear:
- Monitor usage metrics to identify which reports are actually used (and which aren't)
- Update the data model as source schemas change
- Retrain users when reports are modified significantly
- Establish a feedback channel to capture what the solution still doesn't answer
Data Modeling, DAX, and Visualization Best Practices
Why Star Schema Matters
Flat tables and complex multi-table joins feel intuitive until you try to write DAX against them. Star schema reduces complexity, makes measures easier to write and debug, and measurably cuts report load times. A developer joining the project six months later can also understand the model structure without needing the original builder to explain it.
DAX Fundamentals
DAX (Data Analysis Expressions) is the formula language for defining measures and calculated columns. The distinction between the two is important:
- Measures evaluate dynamically in the current filter context - they recalculate as users apply slicers and filters
- Calculated columns compute row by row when the model refreshes and store the result statically
Key DAX categories every solution uses:
- Aggregation:
SUM,AVERAGE,COUNTROWS- the building blocks of most business metrics - Time intelligence:
TOTALYTD,DATESYTD,SAMEPERIODLASTYEAR- for period-over-period comparisons - Context modification:
CALCULATE- modifies the filter context, enabling comparisons that ignore or override what slicers are currently set to
A year-over-year revenue measure, for example, uses CALCULATE with SAMEPERIODLASTYEAR to return the equivalent prior-year period. Against a well-designed star schema, that's a single expression where the equivalent SQL would span multiple subqueries.
Visualization and Performance
Report design practices that drive adoption:
- Drill-through pages so users can click from a summary to underlying detail without leaving Power BI
- Custom tooltip pages showing contextual charts on hover
- Conditional formatting to surface outliers without requiring users to scan every row
- Mobile layout view for field-based teams who need reports on phones
Performance at scale:
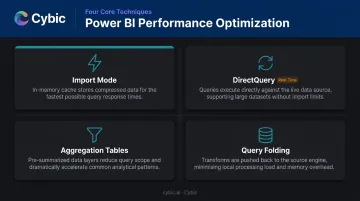
- Import mode handles most datasets - data is cached in memory and queries are fast
- DirectQuery suits near-real-time requirements or very large source systems where importing all data isn't practical
- Aggregation tables pre-summarize large fact tables so common queries hit cached aggregates rather than row-level data
- Query folding pushes transformation logic back to the source database, reducing what Power BI has to process locally
Governance, Security, and Performance in Power BI
Enterprise Power BI solutions require security and governance built into the architecture - not added after the fact. This is especially true in regulated industries like healthcare (HIPAA), financial services, and oil and gas, where access controls and audit trails are compliance requirements, not preferences.
Row-Level Security and Object-Level Security
Row-level security (RLS) restricts what data each user sees within the same report. A regional sales manager sees only their territory; an executive sees all regions - from the same published report. Dynamic RLS uses the user's login identity against a security mapping table, so one role definition handles an entire organization without creating separate reports per user group.
Object-level security (OLS) goes further by restricting access to the underlying metadata itself - not just the visible data. Sensitive financial or HR columns can be hidden from certain user groups entirely, regardless of what the report displays.
Governance Controls
A governed enterprise deployment includes:
- Sensitivity labels (via Microsoft Purview Information Protection) to classify reports by data sensitivity - labels persist to exported formats and can enforce encryption on downloaded .pbix files
- Workspace roles (Admin, Member, Contributor, Viewer) to separate editors from consumers
- Audit logs via the Power BI activity log, which stores up to four weeks of user activity history for access review and compliance reporting
- Certified datasets to designate trusted, endorsed semantic models that others can build on
In HIPAA, GDPR, or SOC 2 regulated environments, these controls need to be wired into the architecture from the start - retrofitting them after deployment creates audit gaps and remediation costs that compound over time.
Deployment Pipelines
Separating development, test, and production environments using Power BI's built-in deployment pipelines keeps untested changes away from live users. It also creates a traceable version history that satisfies both auditor requests and change management documentation requirements.
Connecting Power BI to Modern Data Ecosystems and AI
The Modern Data Stack Architecture
Enterprise Power BI solutions increasingly sit at the reporting layer of a larger stack:
- Azure Synapse Analytics or Databricks - data warehouse or lakehouse serving as the governed data foundation
- Snowflake - cloud data platform for structured analytical workloads
- Azure Data Factory or similar - orchestrating ETL pipelines upstream
- Power BI - connecting via DirectQuery or import to deliver governed reports
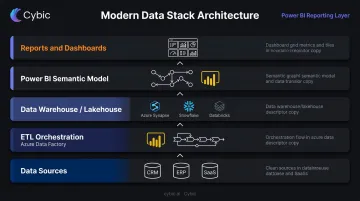
This architecture decouples data engineering from BI reporting. Data engineers maintain pipelines and warehouse structures; BI developers build semantic models and reports on top. Each team works in their optimal environment without stepping on each other.
AI in the Power BI Layer
Two developments are changing what Power BI solutions can do:
- Microsoft Copilot for Power BI - users create and edit report pages with natural language prompts, generate narrative summaries, and explore data through Q&A without writing DAX or building visuals manually
- Embedded ML predictions - churn risk scores, demand forecasts, or anomaly detection flags trained in Azure Machine Learning or Databricks can be surfaced as additional columns in the semantic model, appearing alongside traditional KPIs in the same dashboard
Business users see not just what happened, but what's likely to happen next - without switching tools or requesting a separate analysis.
That capability changes how Power BI fits into a broader architecture. When predictive outputs need to trigger automated workflows or operational decisions, Power BI becomes one layer in a larger system rather than the final destination. Cybic's Drava platform is built for exactly this scenario: it connects enterprise data, machine learning models, and AI reasoning so that Power BI handles reporting while downstream automation and decision support run in parallel.
Frequently Asked Questions
What is a Power BI solution?
A Power BI solution is a governed, end-to-end analytics system that connects data sources, applies a structured semantic model with consistent business logic, and delivers interactive reports to business users. Unlike a standalone dashboard, it's an engineered system: defined pipelines, access controls, and a maintained data model included.
Is Power BI still in demand in 2026 and after?
Yes. Microsoft was named a Leader in the 2025 Gartner Magic Quadrant for Analytics and Business Intelligence Platforms for the 18th consecutive year, placing highest for Ability to Execute. Power BI is also a core component of Microsoft Fabric - the visualization layer within an expanding AI-augmented data platform with a clear long-term roadmap.
What is the difference between PBIX and PBIT?
PBIX is the standard Power BI Desktop file format - it stores the complete report including the data model, queries, and visuals. PBIT is a template file that preserves the report structure and queries but strips out the underlying data, making it ideal for sharing templates that others connect to their own data sources.
What is the difference between Power BI Desktop and Power BI Service?
Power BI Desktop is a free Windows application for building and designing reports and data models locally. Power BI Service is the cloud platform (app.powerbi.com) where reports are published, shared, scheduled for refresh, and accessed by business users from any browser.
How long does it take to build a Power BI solution?
A focused departmental dashboard typically takes 2–4 weeks from requirements to deployment. A full enterprise BI solution with multiple data sources, complex modeling, and governance setup typically takes 2–6 months. Iterative releases deliver usable reports throughout, so teams aren't waiting for a fully complete system before seeing value.
What skills are required for Power BI solution development?
Core skills include data modeling, DAX authoring, Power Query/M for transformations, data visualization design, and SQL for working with source systems. Enterprise deployments add Power BI governance, deployment pipelines, row-level security, and workspace management to that list.