
Introduction
Hospitals generate enormous volumes of data - yet much of it never reaches a decision-maker in time to matter. According to the ONC's interoperability data briefs, a significant share of hospitals still cannot fully find, send, receive, and integrate patient information electronically across all four exchange domains. The result: clinical leaders pull decisions from outdated reports, finance teams wait for month-end reconciliations, and operations managers react to problems rather than preventing them.
The core problem isn't a shortage of data. It's fragmentation. EHRs, billing platforms, lab systems, and scheduling tools each hold pieces of the picture - but none of them talk to each other in a way that surfaces actionable insight.
Power BI addresses that directly. This guide covers:
- How Power BI connects and unifies healthcare's fragmented data sources
- What the four types of analytics look like in practice
- Which dashboards matter most by role
- How HIPAA compliance is handled within the platform
- How to structure an implementation that actually gets used
Key Takeaways
- Power BI unifies EHRs, billing systems, and operational tools into a single real-time view using FHIR connectors and cloud data platforms.
- It supports all four healthcare analytics types - descriptive, diagnostic, predictive, and prescriptive - from one platform.
- Role-specific dashboards give clinicians, operations managers, and CFOs exactly the metrics they need, secured by row-level access controls.
- HIPAA-compliant deployment requires the right Microsoft cloud configuration, a signed BAA, and audit logging.
- A phased pilot targeting one high-value use case builds faster confidence than trying to deploy everything at once.
The Four Types of Healthcare Analytics - and How Power BI Handles Each
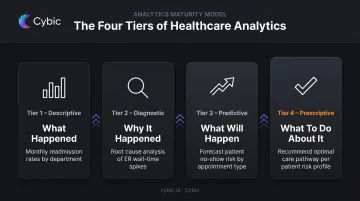
According to StatPearls (NIH/NCBI, 2025), healthcare analytics breaks into five categories, with four forming the core operational framework: descriptive, diagnostic, predictive, and prescriptive. Most organizations enter at the descriptive tier and evolve upward as data infrastructure and analytical maturity improve.
Understanding where your organization sits on this spectrum matters before scoping a Power BI build - because each tier requires different data models, features, and governance controls.
Descriptive Analytics: What Happened
Descriptive analytics answers historical questions through data visualization and reporting.
In Power BI, this means pre-built dashboards pulling live and historical data from EHRs and operational systems. Common outputs include:
- Patient waitlist trends and bed occupancy over time
- Discharge volumes broken down by department
- Monthly revenue cycle summaries by payer
It's the fastest tier to deploy and the most immediately understood by clinical and operational teams.
Diagnostic Analytics: Why It Happened
Diagnostic analytics identifies root causes by letting users drill into the data behind a metric.
Power BI's drill-through capability is built for this. A finance leader spots a spike in claim denials, filters by payer, then by denial reason code, then by specific billing staff - all without leaving the dashboard or running a new report. Investigations that once took days now take minutes.
Predictive Analytics: What Will Happen
Predictive analytics uses statistical modeling to forecast future outcomes.
Power BI integrates with Microsoft Fabric and Azure Machine Learning to surface model outputs directly inside dashboards. Microsoft Research has documented ML approaches for 30-day readmission risk in heart failure patients, and Microsoft Fabric's AI samples include healthcare uplift modeling using LightGBM.
In practice, these model outputs appear embedded alongside operational metrics as:
- Risk scores for individual patients or cohorts
- Trend alerts for staffing, capacity, or demand
- Readmission probability flags tied to discharge workflows
Prescriptive Analytics: What to Do About It
Prescriptive analytics moves from insight to recommendation.
When Power BI is augmented with automation layers and AI logic, it can generate alerts when staffing levels fall below predicted demand, or flag intervention pathways for high-risk patient cohorts.
The difference from predictive analytics is concrete: rather than showing a clinical team that readmission risk is elevated, a prescriptive system surfaces the specific action - a care coordinator follow-up, a medication reconciliation check - directly in the workflow.
Key Power BI Features for Healthcare Analytics
Power BI's value in healthcare goes well beyond dashboards. The platform includes specific capabilities built for the complexity of clinical and operational data environments.
EHR and Multi-Source Data Integration
Power BI connects to healthcare data through multiple verified pathways:
- FHIR connector - Microsoft's Power Query connector for FHIR is generally available and supports both Power BI semantic models and dataflows, enabling direct connection to FHIR-compliant EHR data
- Azure Health Data Services - provides an FHIR service layer for exchanging health data at scale
- Intermediate data platforms - Azure Synapse Analytics, Snowflake, and Amazon Redshift are all supported, allowing organizations to route EHR data through a governed warehouse before it reaches Power BI
- DirectQuery - connects Power BI directly to live data sources without requiring full data imports
Note: there is no verified native connector specifically for Epic, Cerner, or MEDITECH. Integration with those platforms runs through FHIR, API layers, or an intermediate data warehouse.
Role-Based Custom Dashboards
Power BI's row-level security (RLS) and object-level security (OLS) allow the same underlying data model to power fundamentally different views:
| Role | What They See |
|---|---|
| CFO | Claim denial rates, AR aging, cash flow trends, cost per encounter |
| Operations Manager | Bed occupancy, ER throughput, staffing gaps, appointment cancellations |
| Clinical Team | Patient risk scores, length of stay, readmission rates, department outcomes |
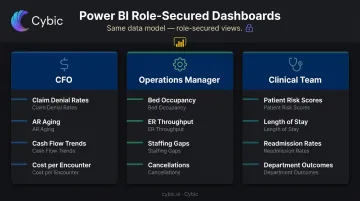
Each user sees only the data they're authorized to access - without separate data models or duplicate reporting infrastructure.
AI-Powered Queries and Anomaly Detection
Power BI's Q&A feature lets non-technical staff ask questions in plain English - "Show me readmission rates by department this quarter" - and receive an instant visual answer. Currently supports English with Spanish in preview.
The built-in anomaly detection feature uses Microsoft's SR-CNN algorithm to automatically identify unexpected values in time-series data - an unexplained spike in infection rates or a sudden drop in collections - without manual monitoring rules.
Real-Time Alerts and Mobile Access
Where anomaly detection catches unexpected patterns automatically, alerts let you define the thresholds you're watching for. Configure them against any KPI: ER wait times, ICU occupancy, claim denial rates. Notifications reach users via email or mobile push.
Dashboards are fully mobile-accessible, which matters for clinicians on rounds and administrators who aren't desk-bound.
Power BI Healthcare Dashboards in Practice
Clinical Quality and Patient Outcomes
A clinical quality dashboard typically tracks:
- Readmission rates by condition and department
- Average length of stay versus benchmark
- Time to antibiotics for sepsis protocols
- High-risk patient flags from predictive models
The value isn't just visibility - it's timing. Clinical leaders can identify which departments have outlier readmission rates and trigger protocol reviews before a quality audit surfaces the same issue months later.
Operations and Resource Management
An operations dashboard covers:
- Bed occupancy by unit, updated in near real-time
- ER throughput metrics including door-to-provider time
- Staffing levels versus patient census
- OR block utilization and scheduling efficiency
- Appointment cancellation and no-show trends
Operations managers use this to make same-day staffing calls, resequence surgical cases, and catch bottlenecks before they create capacity crises.
Revenue Cycle and Financial Performance
A revenue cycle dashboard surfaces:
- Claim denial rates segmented by payer and denial category
- Accounts receivable aging by service line
- Collections performance against targets
- Cost per encounter by department
Finance leaders can identify billing inefficiencies without waiting for month-end reports. Drill-through lets them navigate from a high-level denial spike down to the specific payer, provider, or diagnosis code driving it, then prioritize recovery work accordingly.
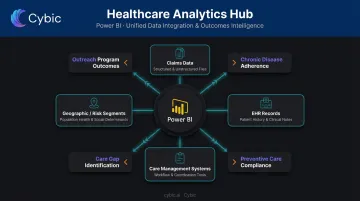
Population Health and Value-Based Care
Financial performance tells one part of the story. For organizations under value-based care contracts, the other part is longitudinal: how well are patient populations being managed over time? Power BI aggregates data across patient cohorts to track:
- Chronic disease management adherence
- Preventive care compliance rates
- Care gap identification by geography or risk segment
- Outreach program outcomes
Pulling from claims data, EHR records, and care management systems into a single model, Power BI gives care teams the population-level view that value-based contracts demand - one where gaps are visible before they become penalties.
HIPAA Compliance, Data Security, and Governance
Compliance Framework
Power BI runs on Microsoft's cloud infrastructure, which supports HIPAA/HITECH-compliant deployments. Organizations can sign a Business Associate Agreement with Microsoft, which is a prerequisite for using covered Microsoft cloud services to process PHI. Microsoft also publishes compliance offerings covering ISO/IEC 27001, HITRUST CSF, SOC 2 Type II, and FedRAMP - verify exact scope for each in the Microsoft Service Trust Portal.
An important clarification: Power BI does not automatically make a deployment HIPAA-compliant. Compliance depends on how it's configured.
Security Controls
The security layer for a healthcare Power BI deployment includes:
- Row-level security (RLS) - restricts data visibility by user role using static or dynamic rules
- Object-level security (OLS) - hides sensitive tables or columns from unauthorized users entirely, including metadata
- Audit logging - every view, export, and share event is captured through Microsoft Purview audit capabilities
- Multi-factor authentication - enforced via Microsoft Entra ID with Conditional Access policies
- Encryption - data is encrypted in transit and at rest
Governance as an Ongoing Practice
Governance requires ongoing commitment, not a one-time setup. The most common failure mode in healthcare analytics programs is a trust breakdown: different departments using conflicting metric definitions, unofficial spreadsheets circulating alongside official dashboards, no clear owner for a certified dataset.
Power BI's certified datasets, metric ownership assignments, and data catalog features address this structurally. But embedding governance at the architecture level from the start - defining metric owners, access tiers, and naming standards before the first dashboard goes live - prevents the "shadow reporting" problem from taking root. Cybic structures healthcare data implementations so that RBAC, audit trails, and governance frameworks are built into the architecture from day one - not retrofitted after deployment.
Getting Started with Power BI in Healthcare
Phase 1: Audit and Pilot Selection
Before building anything, map the current data landscape:
- Inventory all systems: EHR platform, billing and RCM tools, scheduling, lab systems, any existing data warehouse
- Identify the highest-value analytics gap - where is decision-making most dependent on manual reports, outdated data, or gut instinct?
- Pick one pilot use case that is both high-value and tractable: "clinical team has no visibility into readmission risk" or "finance cannot see claim denials until month-end" are both strong starting points
The pilot selection matters more than most teams expect. A well-chosen first use case builds organizational confidence in data-driven decisions. A poorly chosen one creates skepticism that stalls adoption.
Phase 2: Governance and Data Model
Establish governance before writing a single DAX measure:
- Assign metric owners: designate who is accountable for each KPI definition before any measure is published
- Establish naming standards: consistent field names, date formats, and dimension labels across all data sources
- Configure access controls: document the role hierarchy, row-level security rules, and OLS requirements for sensitive fields
- Build the semantic model: a star schema with shared dimensions for Patient, Provider, Location, and Time supports multiple dashboard views from a single source of truth
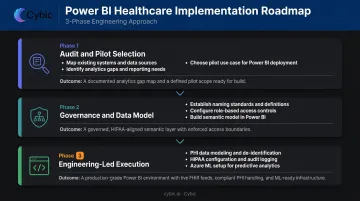
Dashboard development starts only after these governance layers are in place: solve the specific pilot problem, release to a limited user group, collect feedback, and iterate. The sequence is deliberate - governance gaps discovered post-deployment are far more expensive to fix than ones caught at the model level.
Phase 3: Engineering-Led Execution
Healthcare Power BI implementations carry complexity that self-service approaches routinely underestimate. FHIR integration with EHR systems, PHI data modeling, HIPAA control configuration, and Azure ML layer setup all require engineering depth that business-user tooling wasn't designed to handle.
Cybic's healthcare data engineering work is built around deploying systems that integrate into existing clinical and operational infrastructure from day one. Governance, security controls, and compliance configurations are embedded at the architectural level - not added after the fact - because retrofitting HIPAA controls onto a live dashboard serving protected health information is a different problem than building them in from the start.
Frequently Asked Questions
Is Power BI used in healthcare?
Yes. Power BI is used across hospitals, health systems, and payers for clinical dashboards, revenue cycle reporting, and population health tracking. Microsoft maintains a dedicated healthcare Power BI product page and has published customer stories from organizations including UNC Health and Santeon.
What are the four types of data analytics in healthcare?
The four types are descriptive (what happened), diagnostic (why it happened), predictive (what will happen), and prescriptive (what should be done). Power BI supports all four. Most organizations start with descriptive reporting and advance toward predictive and prescriptive use cases as their data infrastructure matures.
Can Power BI connect directly to EHR systems like Epic or Cerner?
Power BI connects to EHR data via FHIR connectors, APIs, and intermediate data platforms like Azure Synapse or Snowflake. No native connector for Epic, Cerner, or MEDITECH exists in current Microsoft documentation. The integration method depends on the EHR vendor and your organization's data architecture.
Is Power BI HIPAA compliant?
Power BI can be configured for HIPAA-compliant use when deployed with the appropriate Microsoft cloud controls. Organizations must sign a Business Associate Agreement with Microsoft and implement required settings including encryption, role-based access controls, and audit logging. Configuration determines compliance. It is not automatic.
What healthcare KPIs can Power BI track?
Power BI tracks KPIs across three core domains: clinical (readmission rates, length of stay, patient satisfaction), operational (bed occupancy, ER throughput, staffing ratios), and financial (claim denial rates, AR aging, cost per encounter). Dashboards are customizable by role and department from a shared data model.
How long does a Power BI healthcare implementation typically take?
A focused pilot targeting a single use case can typically go live in 4–8 weeks. Enterprise-wide deployments covering clinical, operational, and financial analytics often take several months, especially when FHIR integration, data governance, and HIPAA compliance configurations are in scope.